The largest challenge faced by SAP’s approximately 13,000 licensed on-premise Human Capital Management (HCM) customers has always been getting data out of the SAP system.
I’ve spent a good deal of time and energy counselling organizations about their options for reporting in SAP HCM. I’ve given presentations at events around the world telling customers about their options, including quick cheats for getting data, best practices, which tools to use and when, and my overall advice for an organization’s reporting strategy.
Essential reports you need every day
There are a handful of reports that EVERY customer needs to manage their organization. I have put together a list of some of these reports under the categories of Personnel Administration, Auditing and Compliance, Benefits, Organizational Management, Payroll, Time Management & Evaluation, SuccessFactors and System Configuration. Many of these reports are designed for the operational running of a business to assist organizations in processing their employees every day, including headcounts, movement, pay reconciliations, auditing of missing data, organizational structures, time keeping etc.
These reports focus on the operational items needed to manage the business, unlike my earlier blog that talked more about the analytics needed for planning for the future strategy of the business.
Free reports in Query Manager
Because every company needs them, I have ensured that all of these reports are available for free in the EPI-USE Labs’ Query Manager solution so that all customers have access to them from day 1. The reports can be used ‘as is’, or modified to meet a customer’s unique needs, all with the simple ease of use of the Query Manager solution.
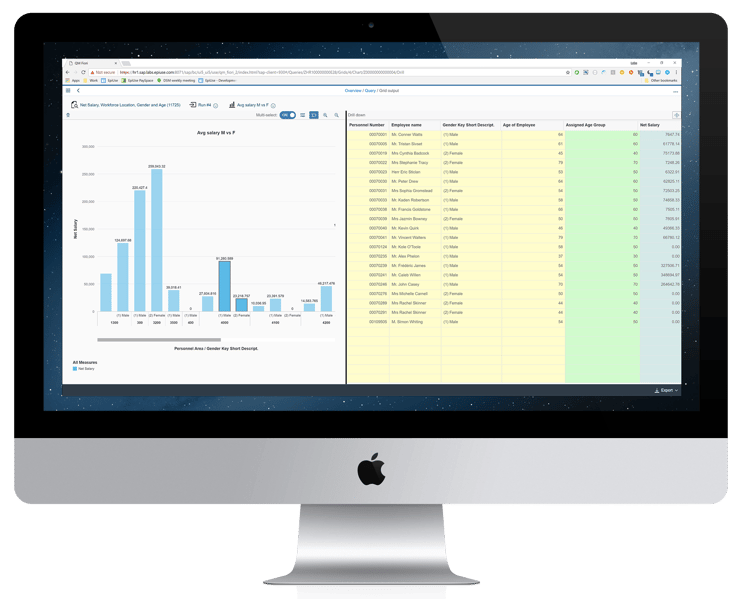
Because Query Manager leverages Fiori technology, report data is more visually stunning, interactive and accessible via any browser, see sample below.

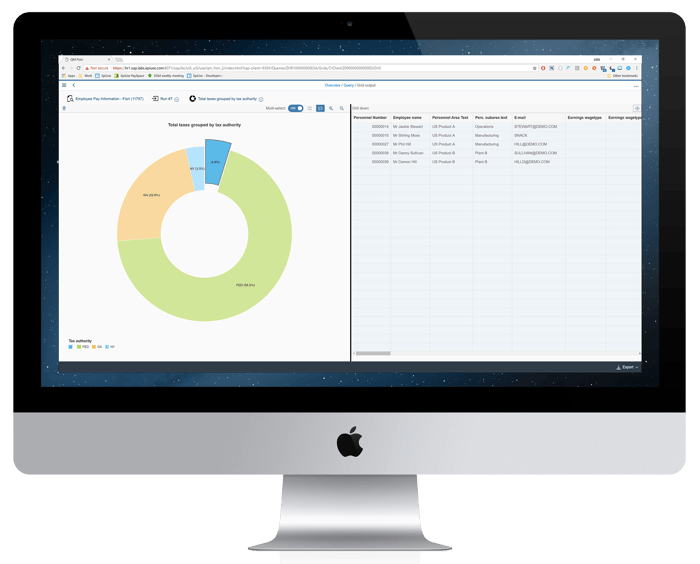
Users can also interact with the report data for a meaningful interpretation or visual experience by creating charts, live in your browser from your data. Select your report and then the type of chart that you would like to create, and you can instantly visualize and interact with your data, including drilldown capabilities; see sample below.

To check out this list of reports that come with Query Manager, please click below. If you would like to see Query Manager in action, please do not hesitate to reach out to me directly.
Danielle Larocca
With over 20 years in SAP Human Capital Management, Danielle is a recognized leader in HR technology. She holds the distinguished roles of SAP Mentor and SuccessFactors Confidant, and serves as HCM Chairperson for ASUG (America's SAP User Group). Danielle is a sought-after speaker at international conferences, sharing insights on HR tech trends. She has authored four best-selling books on SAP and holds certifications in both SAP and SuccessFactors technologies.