Users have always been able to complete tasks using SAP products, but as technology evolved this wasn’t sufficient, as users expected more. SAP realized this, and created a user experience to allow users to complete the same tasks in a more user-friendly and pleasing way. This is known as SAP Fiori. The purpose of this blog is to give you a quick overview of what Fiori is, and some samples of how the technology benefits you.
Let’s start with the technical definition: SAP Fiori mainly refers to the user experience specifications and set of business applications that adhere to these guidelines, and was launched May 2013. It enables SAP applications to be used on desktop computers, tablets and smartphones. It’s that last part that is the important one; Fiori apps make it possible for you to execute and view your SAP data outside of the SAP GUI via a browser.
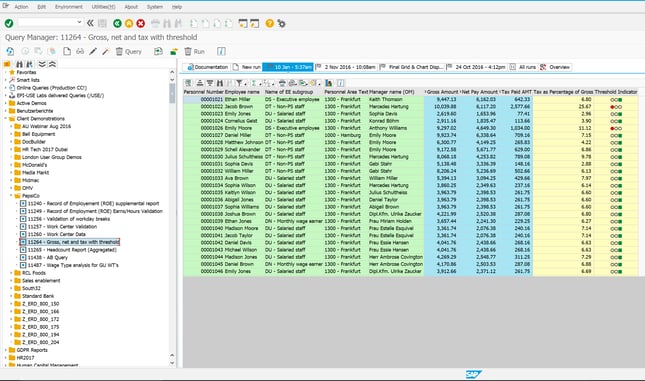
Before the launch of Fiori, if you wanted to run an SAP report, like this sample Query Manager report for reviewing gross, net and tax thresholds from SAP Payroll, you would need to log into your SAP system and execute the transaction within SAP to produce the report. It would look like the report below:
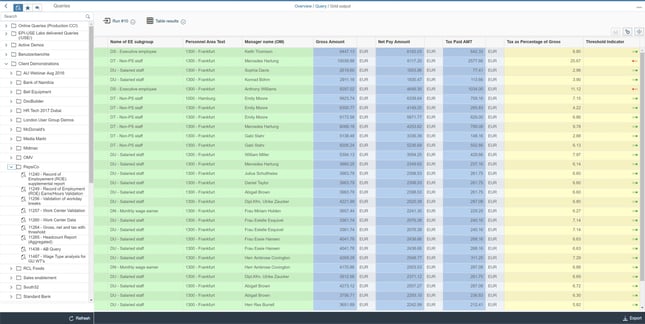
With the advent of Fiori, you no longer have to go to your PC and log into your SAP instance and access the transaction code to get to a report. You can simply access the report via an HTML5 enabled browser either on your PC, smartphone or tablet. When you do so, the report will appear like the one shown below.
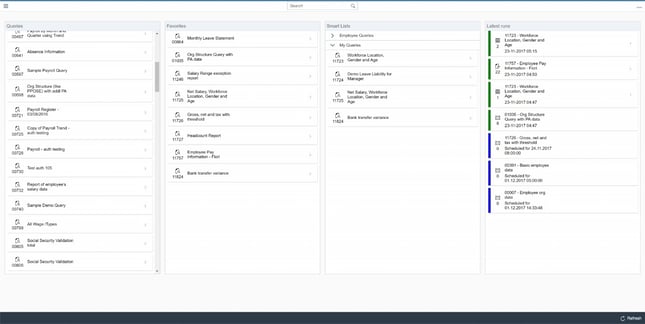
Now, because that report is web-enabled you have access to interact with it in a way you did not have previously, starting with a Dashboard view of all of your reports as shown in the sample below. Here you can quickly search for your queries, set favorites, access smart lists and view results of previously run reports.
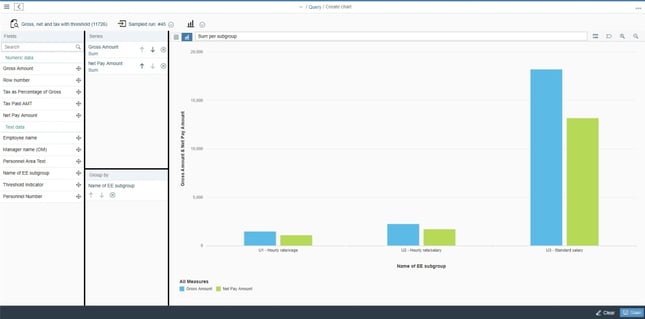
You can also interact with your report data for a meaningful interpretation or visual experience by creating charts, live in your browser from your data. Select your report and then the type of chart that you would like to create, and you can instantly visualize and interact with your data, including drilldown capabilities; see sample below.
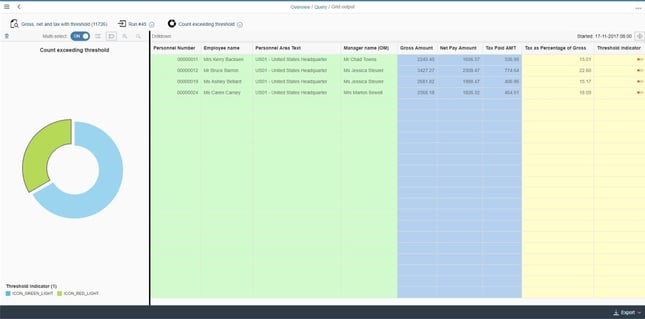
You can choose from several different chart outputs including Line, Bar, Pie etc. You can even perform aggregations on selected data (sum, average, count, min, max etc.).
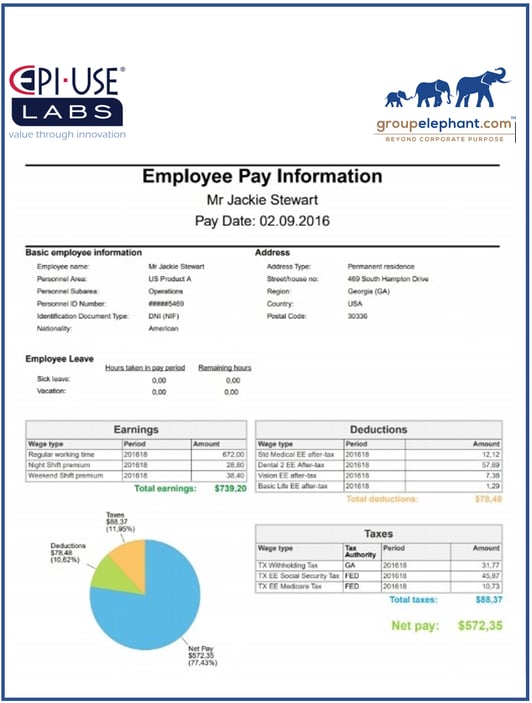
In addition, Document (Adobe pdf) and ALV grid formats are available for reports so you can vary the output as needed. In the sample below, a report was used to gather a list of employees to send them each a personalized letter containing their specific information from the SAP HCM and Payroll system.
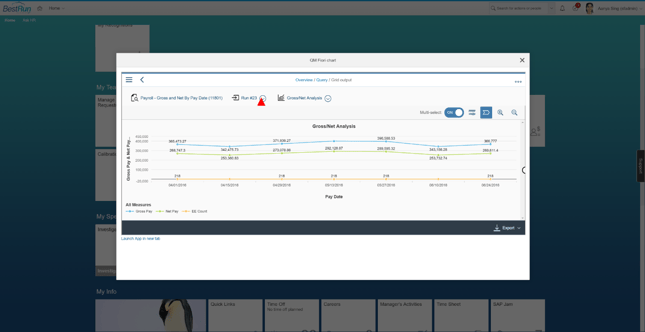
For those customers who have begun the move to SuccessFactors, you can even access your reports via SuccessFactors leveraging this same Fiori technology, sample below.
I hope this gives you a good idea of what Fiori is and what it can do.
To learn more about Query Manager, please click here and feel free to reach out to us with any queries.
With over 20 years in SAP Human Capital Management, Danielle is a recognized leader in HR technology. She holds the distinguished roles of SAP Mentor and SuccessFactors Confidant, and serves as HCM Chairperson for ASUG (America's SAP User Group). Danielle is a sought-after speaker at international conferences, sharing insights on HR tech trends. She has authored four best-selling books on SAP and holds certifications in both SAP and SuccessFactors technologies.