Trying to Compare Query Manager and SAP SuccessFactors Workforce Analytics is like trying to compare Apples and Oranges
By Danielle Larocca | 09 October 2017
Comparing Apples to Oranges
Query Manager is the leading reporting solution used by thousands of SAP HCM customers around the world every day to solve SAP HCM reporting challenges, including:
1. Reliance on IT to produce reports (using technology like custom-coded ABAP)
2. Multiple solutions/utilities + Excel needed to create reports for various modules
3. Transactional and Payroll data not included in BW
As SAP HCM became more mature, and with the acquisition of SuccessFactors, Query Manager has added functionality that allows users to execute reports via a browser (including mobile devices) and includes the ability to report on data from both SAP and SuccessFactors at the same time.
Some of the most common themes about Query Manager reporting include:
1. No implementation required to install (it’s simply an SAP transport), you can be up and running in minutes
2. All data is live, in real time, and you can include data from virtually any data source*
3. The tool is easy to use and automates the delivery of reports via email, your portal MSS, etc.
Query Manager sounds great, so why is comparing it to the highly regarded SAP SuccessFactors Workforce Analytics like comparing apples to oranges? In this blog, I review three of the main reasons why.
Reason 1 - Reporting vs. Analytics
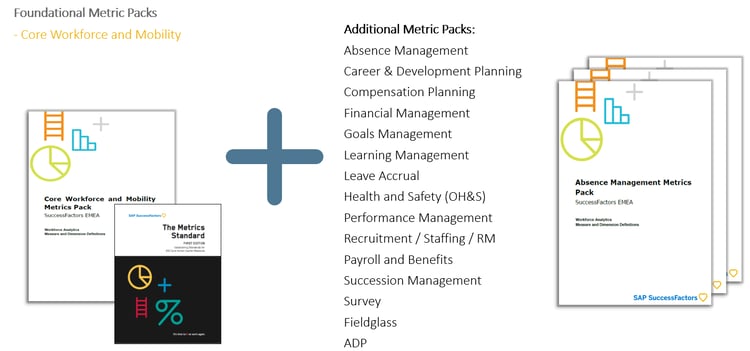
For starters, SAP SuccessFactors Workforce Analytics (WFA) is not a transactional reporting tool. Rather WFA is a purpose-built analytics application for line of business HR. SAP SuccessFactors Workforce Analytics combines BI capabilities and predefined content. For content, at its core are metrics packs, which are groupings of metrics for various HR and talent management functional areas, including Employee Central, Recruitment, Learning, Compensation, etc. Each metrics pack requires its own configuration and implementation with Core Workforce and Mobility as the foundational metrics pack based on data from your core HR system of record. Customers used to have to purchase metrics packs separately, but since 2013 the WFA license has included ALL metrics packs. In addition, WFA provides issue-focused analyses and report templates. It also comes with analysis tools such as Investigate, and the ability to share information and insights in form of dashboards, reports, or headline alerts. More importantly, as mentioned above, WFA is not intended for transactional reporting. The goal of WFA is to accelerate the process to transform people data for analytics and shed insights into workforce impact on the business, but more about that in a minute.
First, here are some of the most common themes about WFA:
1. An implementation project is required (minimum 100 business days for the foundational Core Workforce and Mobility metrics pack, and subsequently on average about 6-8 weeks per additional metrics pack. There are over 15 metrics packs).

[Photo Source SAP]
2. WFA is designed primarily for analytics, not reporting (there is a big difference)
3. Once implemented, WFA provides best practice, pre-defined metrics for data analysis
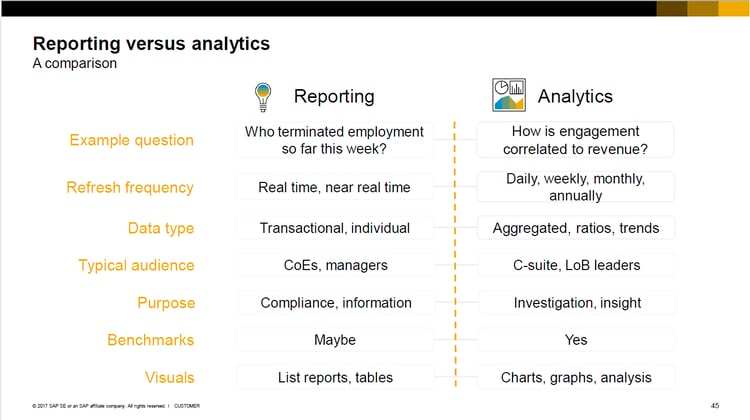
These two distinct capabilities are designed to solve two different business challenges, each with their own ROI. The easiest way to think about is to consider the difference between reporting and analytics. You may have seen various people use the terms “reporting” and “analytics” interchangeably. It is important to point out that reporting and analysis are very different in terms of their purpose, tasks, outputs, delivery, and value.
Reporting is best defined as: The process of organizing data into informational summaries to monitor how different areas of a business are performing.
Analytics is defined as: The process of exploring data and reports in order to extract meaningful insights that can be used to better understand and improve business performance.
I know it seems just like fancy jargon, but this graphic – provided by SAP in its Analytics Roadmap update from SuccessConnect 2017 – does a better job of pointing out the nuanced differences between the two.

[Photo Source SAP]
The ROI of reporting is achieved by decreasing the effort required to deliver data to consumers and the ROI of analytics is achieved by increasing the business value derived from using the data in people decisions.
Reason 2 – It is Live Transactional Data vs. Curated, transformed Key Result Measures
Query Manager comes with over 250 pre-delivered reports from each application area that allow you to report on each aspect of your HCM data. In addition, customers can download reports created by other users and customers from the online customer community. Users can create reports from scratch or via a template using any fields, any measurement criteria, etc., and most importantly can include the lowest level of operational data as needed. For example, in Query Manager you can create a report that lists every employee and how much overtime they have earned by department and rate for the past year.
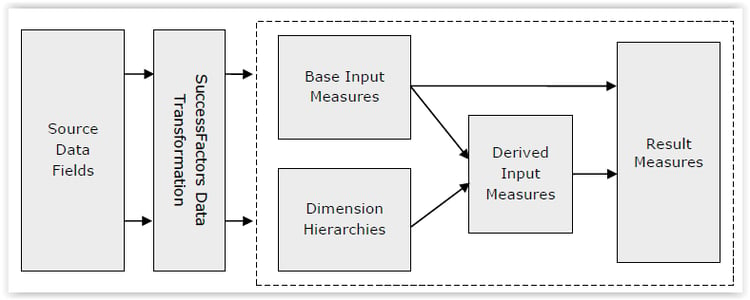
In WFA, you have the ability to select fields or data to analyze from a pre-determined model (sample shown below from SAP’s Workforce Analytics Implementation Guide), however most of the work is not done at table/field level. The process becomes less technical and more in HR language where users are access metrics by their name, and filtering and slicing and dicing according to characteristics (or dimensions).

[Photo Source SAP]
For each functional area in SAP SuccessFactors (or any 3rd party HR or talent management system of record), this sophisticated model takes pre-determined source data fields from your system and transforms them in conjunction with base input measures, dimension hierarchies and derived input values to produce meaningful result measures (output). This is often not transactional data. Returning to the SAP graphic shown earlier in the blog, this is aggregated or summarized data often shown in conjunction with other key variables. Using our previous example, the output in WFA would focus on the overtime rate (for example). This could be looked at by department for a particular age group, and if the user chooses so, they can drill to see individual level detail. WFA could be used to produce a trend correlation analysis between a segment of employees who worked overtime and employee retention. In Workforce Analytics the focus is always on the segmentation as opposed to individual, with the ability to drill to see the individual’s details. A main objective is to identify systemic issues in an organization, and then drill to the individual level. This will help to keep focus on large issues rather than getting bogged down with individuals, who could be an anomaly.
It is important to note that one solution is not better than the other. Organizations need both a reporting tool and an analytics solution to answer different types of questions. According to an interesting survey about Driving HR Impact in a Changing World commissioned by SAP SuccessFactors, organizations are spending over 850 hours on average per year on HR reporting. Of those 850 hours, almost 70% of it is based on admin and professional reporting as opposed to strategic planning and analytics.
Reason 3 – No Transactional Payroll, Benefits and Time Management/Evaluation Data in WFA
In the previous section, I discussed transactional data. Key areas where transactional data is critical for reporting include Payroll, Benefits and Time Management/Evaluation Data. It is in these three areas that a tool like Query Manager thrives. Benefits and time data in SAP SuccessFactors is limited and often leverages integration via partners. Does WFA allow the ability to report on Payroll data? The fast answer is a soft yes. There is a metrics pack for payroll, but it is not intended for operational payroll reporting or compliance reporting. Let’s take a moment to look deeper into that question. Existing SAP Payroll customers currently have 4 options for their Payroll:
1) Keeping your SAP on-premise payroll “as is”
2) Migrating to SAP SuccessFactors Employee Central Payroll (ECP)
3) SAP SuccessFactors Managed Payroll, or
4). Outsourcing your payroll (MCPO)
As you may know, each of the first three options still use SAP payroll as its foundational source. On-premise is the same as you have now, ECP is a re-implemented simplified version of the SAP Payroll you have now and the managed payroll is the payroll you have now, as is, hosted on a cloud server.
So essentially, each of the first three scenarios uses traditional SAP Payroll behind-the-scenes. If there is one thing we all know, it’s that reporting on SAP Payroll is not easy to do and accessing transactional data can be cumbersome in SAP using utilities like the Wage Type Reporter. WFA on the other hand, offers content related to payroll analytics by leveraging data from payroll results. Below is a sample list of result measures available to customers who implement the WFA Payroll metrics pack:
-
Actual Headcount as a Percentage of Plan
-
Overtime Compensation Rate
-
Bonus Compensation Rate
-
Overtime Expense per FTE
-
Overtime Hours Rate
-
Bonus Actual to Potential Rate
-
Bonus Receipt Rate
-
Direct Cost of Voluntary Termination
-
Direct Cost of Voluntary Termination per FTE
-
Direct Compensation per FTE
-
Base Compensation per FTE
-
Direct Compensation per Work Hour
-
Base Compensation per Work Hour
-
Bonus Eligibility Rate
-
Average Compa Ratio
-
Total Workforce Annual Planned Salary
-
Actual Salary Spending as a Percentage of Business Plan
-
Average Incentive Plan Target Amount per FTE
-
Total Target Direct Compensation per FTE
This is not an all-inclusive list, but it gives you an idea of the types of data that are available for payroll. There is some very good analysis stuff in here that you would not traditionally find in SAP on-premise reporting, including “Direct cost of voluntary termination and “actual headcount as a percentage of plan”. This type of curated data is possible via integration with other metrics packs.
However, the transactional pay reporting that Payroll managers use to reconcile their payrolls, etc., is not included in the WFA metrics pack. Detailed payroll reporting often includes Payroll registers, Wage Type Analysis, Payroll Reconciliation reports (including retros and claims), Gross to Net Pay to Pay Difference, Payroll Reconciliation Wage Type Analysis, etc. Currently, this type of transactional level reporting is not part of WFA. This type of data is available only in Query Manager.
Hopefully this blog has given an answer to the question I receive daily about the difference between Query Manager and WFA. If you want to learn more about SAP SuccessFactors Workforce Analytics please visit here. To learn more about Query Manager please feel free to contact me or visit our Query Manager website.
Danielle Larocca
With over 20 years in SAP Human Capital Management, Danielle is a recognized leader in HR technology. She holds the distinguished roles of SAP Mentor and SuccessFactors Confidant, and serves as HCM Chairperson for ASUG (America's SAP User Group). Danielle is a sought-after speaker at international conferences, sharing insights on HR tech trends. She has authored four best-selling books on SAP and holds certifications in both SAP and SuccessFactors technologies.